On this page
The Statistics section answers one question: how much traffic came in and what it brought. It shows clicks, leads by phase and money for the period you pick, broken down by day, hour, offer, flow, country, source or another dimension. This page covers flat reports. In a flat report the table has one row per value of a dimension, for example one offer. Reports where you can expand a row by the next dimension are described on the page Hierarchical reports. The meaning of each column is in Metrics and formulas.
Which report to open#
| What you want to know | Where to look | Where it is described |
|---|---|---|
| How many clicks, leads and money one dimension gave for a period: day, hour, offer, flow, country, source or any other you choose | Clicks statistics, Clicks by date, Clicks by hour, Clicks by offer, Clicks by flow, Clicks by geo, Clicks by source | below on this page |
| At which step of the chain “source, campaign, creative” or “site, device” conversion is lost | Clicks by UTM, Clicks by sites, Clicks by device, Click analytics | Hierarchical reports |
| What happened to a particular click or lead | Browse clicks in the Statistics group and Leads in the main menu | Leads and clicks |
| How the whole team and each member perform | the items of the Team group | Teamwork |
| The same numbers in your own program | — | Statistics in the API |
Where to find the numbers you need.
Lead analytics is a separate lead report with its own grouping and column settings. This help does not cover it.
The network can hide any item of the Statistics group, so your menu may have fewer of them. If the numbers for one period do not match in two reports, the causes are explained on the page Where the numbers come from. The agency has no Clicks by flow item but has External marks. See the section For agencies.
Flat reports#
One screen builds all seven reports. Only the dimension the rows are grouped by differs. On Clicks statistics you choose the dimension yourself. The other six menu items are the same report with the dimension already chosen.
| Menu item | Table row | Period on open |
|---|---|---|
| Clicks statistics | a dimension from the list, “Offer” at first | 7 days |
| Clicks by date | day | 15 days |
| Clicks by hour | hour | 7 days |
| Clicks by offer | offer | 7 days |
| Clicks by flow | flow | 7 days |
| Clicks by geo | country | 7 days |
| Clicks by source | traffic source | 7 days |
Flat reports. The period always includes today.
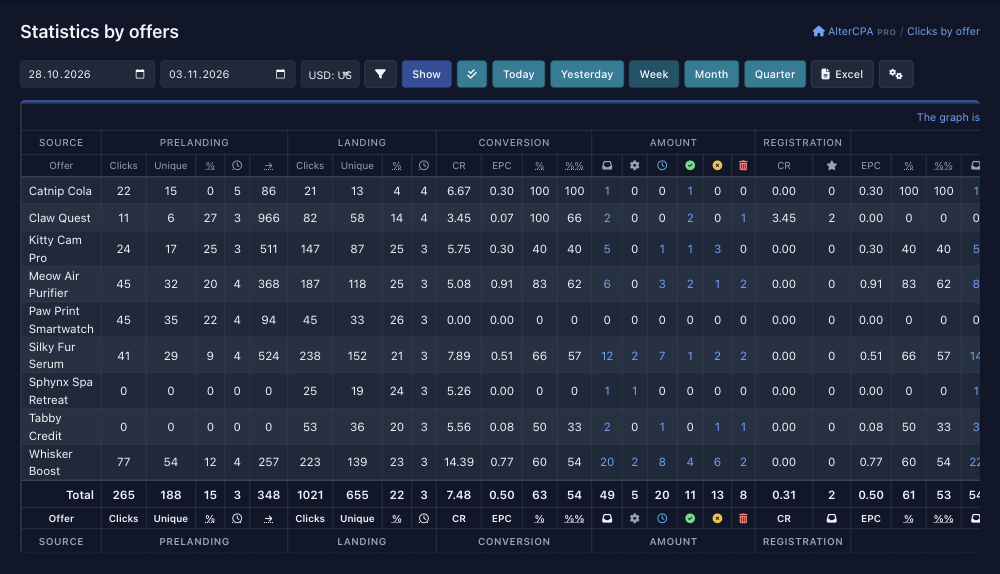
The row order depends on the report. In Clicks by date, rows go from the newest day to the oldest, and a day with no clicks and no leads is left out of the table. Clicks by hour always has 24 rows, from “00:00-00:59” to “23:00-23:59”, with zeros for empty hours. In the other reports, rows go in alphabetical order of their names. Click the heading of any column to sort the table by it.
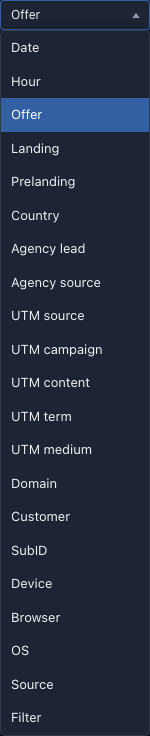
The dimension list on Clicks statistics has “Date”, “Hour”, “Offer”, “Flow”, “Landing”, “Prelanding”, “Country”, five UTM tags (source, campaign, content, term, medium), “Domain”, “Customer”, “SubID”, “Device”, “Browser”, “OS”, “Source” and “Filter”. “Landing” and “Prelanding” are in the list only if the network shows affiliates the columns for clicks on landings and prelandings. The network may remove other dimensions too, so your list may be shorter. The “Filter” dimension splits clicks by the result of traffic filtering: “Valid visit” or the reason the click was filtered out. For details, see Filters and trafback. The agency has no “Flow” dimension but has “Agency lead” and “Agency source” (For agencies). A report has one dimension for the whole table. To break a row down further, open a hierarchical report.
How to build a report#
-
Open the report. In the Statistics menu, select an item from the table above. The report opens for the default period.
-
Select the row dimension. On Clicks statistics only: use the list to the left of the dates. In the other reports the dimension is already set.
-
Set the period. Enter the first and last day in the two date fields. Or click Today, Yesterday, Week, Month or Quarter. These buttons change the period at once and keep the dimension and conditions. The button for the current period is highlighted.
-
Narrow the selection if needed. On Clicks by date, Clicks by hour, Clicks by geo and Clicks by source, the panel itself has offer and flow lists, if you have flows. Clicks by flow has only the offer list. The agency has no flows, so its panel has only the offer list. The other conditions are set in the “Search” window. The button with a funnel opens it.
-
Click “Show”. The dates and lists on the panel apply when you click Show. The period buttons and Show target (valid) clicks only reload the report on their own.
 12345678
A few things to know about the period. “Week” covers today and the six days before it, “Month” covers the last month up to and including today, and “Quarter” covers the last three months. These are not calendar weeks, months and quarters. They are periods of the same length that end today.
The “Search” window (the “Find” button applies the conditions) has conditions for offer, flow, country, landing, prelanding, each of the UTM tags, domain, customer, device, OS, browser, traffic source and filtering result. For text conditions, the empty value checkbox keeps the rows where the tag is not set. The number next to the funnel shows how many conditions from the window are on. The window does not repeat the condition for the dimension the rows are built by, or the offer and flow conditions that are already on the panel. In the agency's window there are no conditions for flow, landing and prelanding. “Source order ID” and “Source affiliate ID” take their place.
The other buttons on the panel:
- Excel downloads the table as an Excel file (.xlsx) with the same period, dimension, conditions and columns.
- The currency list appears if the network has more than one currency or has set it up that way. The sums in the report are converted to the selected currency, and your choice is remembered for the session.
- Settings opens the column picker. See Which columns to show.
Target clicks only
The button with a double check mark, Show target (valid) clicks only, keeps only the clicks with the result “Valid visit” in the report. These are the clicks the traffic filters did not reject: bots, black lists, country, language, ad ID, trafback (Filters and trafback). The button is highlighted when on. Click it again to bring all clicks back.
By default the button is off, and the report counts all clicks, including the rejected ones. The button does not change leads. They stay the same while the clicks become fewer, so if the filters rejected anything, CR and EPC are higher with the button on. A report with the “Filter” dimension has no such button, because the rejected visits are separate rows there anyway.
The report table#
The first column holds the dimension values: offer names, dates, countries. Above it, the header shows the dimension name, for example “Offer”. The other columns are grouped under shared headings:
- “Prelanding” and “Landing” — clicks, uniques, failure rate and time on site. Prelanding also has the share of clicks passed on to the landing.
- “Conversion” — CR, EPC and two versions of approve.
- “Amount” — six lead counters shown as icons: total, waiting, hold, accepted, cancelled, trash. The same phases also appear as separate groups “Total”, “Accepted”, “Waiting”, “Hold” and “Cancelled”, each with a count and a sum. “Money” breaks the accepted leads down into income, expense and profit.
- “Invoice”, “Buyout” and “Traffic” (cost per click, expense, profit, ROI) are extra groups. Not every network turns them on.
If the network keeps extra statistics by goal, each goal has its own group named after it. For what a column counts and by what formula, see Metrics and formulas.
The “Total” row sits at the bottom, under the other rows. It appears when the table has more than one row. If there are no clicks and no leads for the period, the table shows “No statistics found for chosen period” instead of rows. Clicks by hour keeps its 24 rows with zeros instead of the message. A row is colored when it has more than 100 unique clicks and a low CR: yellow below 1%, red below 0.1%.
Which columns to show#
The Settings button opens a window with the list of columns the network lets you turn on, one checkbox per column: “Prelanding: clicks”, “Landing: failure percent”, “Leads count: approved”, “Leads money: approved”, “Invoice: total”, “CPC: ROI” and so on. Select the ones you need and click Save. The page reopens with the new set. If you turn off all the columns of a group, its heading disappears too.
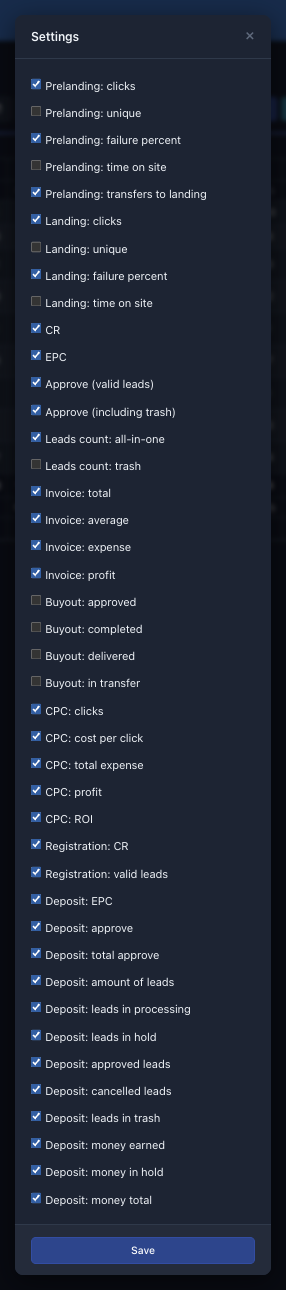
- The network decides which columns are on from the start and which ones you can turn on at all. Your checkmarks override its choice, but you cannot turn on columns the network does not offer.
- The set is remembered for you. It applies in all reports of the “Statistics” section, flat and hierarchical, and in the Excel export.
- The main columns are clicks on the prelanding and landing, CR, EPC, approve, and the counts and sums for leads. The extra ones are “Invoice”, “Buyout” and “CPC”. Not every network offers them.
The graph#
Above the table there is a link “The graph is hidden, press here to show”. Click it and a graph appears above the table. For the “Date” dimension (the Clicks by date report or the same slice on Clicks statistics) it shows lines by day. In the other reports it shows bars by table row. The link is there only while the report has rows. Under the graph, above the columns, are checkboxes. Use them to pick the columns to plot, up to 16 at a time. The “On the graph” link hides the graph again.
The report remembers separately whether its graph is shown. The choice of columns on the graph is one for all reports.
From a number to leads#
Row names in a flat report are not links. To get to the leads, use the counters: in the columns with lead counts, a number above zero is a link. The number in the “Total” column opens all leads of that row. The number in a phase column (“Waiting”, “Hold”, “Accepted”, “Cancelled” or “Trash”) opens only the leads of that phase (Order phases). The list receives the period, the row's dimension value and the other conditions of the report. Sums and percentages are not links. The “Total” counter does not include trash (Metrics and formulas), but its link leads to all leads of the row, so the list may hold more orders than the number says.

The list the link leads to is Leads and clicks. Its columns and conditions are described there.
For agencies#
The agency sees the same Statistics section, with the same columns, formulas and workflow as described above. The menu and a few dimensions differ. For what agency tags are, see Tags and pixels.
The “Statistics” menu for agencies
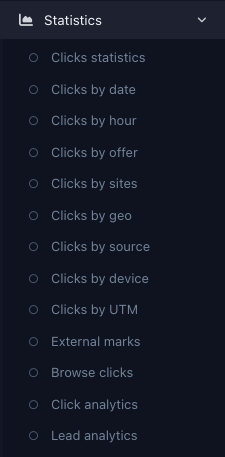
- Flat reports: Clicks statistics, Clicks by date, Clicks by hour, Clicks by offer, Clicks by geo, Clicks by source, as above.
- Hierarchical reports: Clicks by sites, Clicks by device, Clicks by UTM, External marks, Click analytics. See Hierarchical reports.
- Browse clicks is the click log. See Leads and clicks. Leads is in the main menu, as for an affiliate.
- Lead analytics is the same report as for an affiliate.
The agency's menu has no Clicks by flow item, and the “Flow” dimension is missing from the lists and from the “Search” window. The External marks report appears instead. The agency has no flows. Its traffic comes through links from the link generator and from split tests, and through the API key (Link generator for an agency, Split tests).
What only agencies have
- “External marks”. A hierarchical report that is not in the affiliate menu. It breaks traffic down first by the agency's tags (“Agency source” and “Agency lead”), then by domain and UTM tags. It works as a substitute for flow statistics.
- Two dimensions in the “Clicks statistics” list. “Agency lead” is the value of the
extutag, and “Agency source” is the value of theextstag. In the “Search” window the same values are called “Source order ID” and “Source affiliate ID”, and they stand there in place of the conditions for flow, landing and prelanding. For where the tags come from, see Tags and pixels. - A different “Click analytics”. Its chain has no “Flow” dimension, but “Agency source” and “Agency lead” come right after “Countries”. Read the whole chain on the page Hierarchical reports.
The agency's reports count all of its traffic that came through links and the API key. To break it down by the agency's affiliates, use the “Agency source” dimension.