On this page
The columns of the Statistics reports are formulas over clicks and leads. This is the most tedious section of the manual. Read it at bedtime and you will fall asleep faster. The page is a dictionary: it says what each column means and how it is calculated. The main metrics come first. Almost every network has them: clicks, CR, EPC, approve, leads and money. Then come the extra metrics, which not every network turns on: invoice and buyout, traffic cost with ROI, and goal metrics.
The formulas are the same in flat reports (Summary statistics), in hierarchical reports (Hierarchical reports), in the “Total” row under the table and in the Statistics API. To recalculate the numbers from an API response yourself, open What to calculate yourself. If your number does not match another report or your ad network, Where the numbers come from explains the reasons.
How to read this page#
Your network decides which columns you see. The Settings button on the report toolbar opens the list of allowed columns (Summary statistics). This page describes all columns, so you may not have some of them.
Each column has two names. In the Settings window a column is called, for example, Prelanding: failure percent, while in the table header it is a “%” icon under the “Prelanding” heading. A tooltip for the icon appears on hover. The tables below give both names.
The formulas use short symbols. They are the same names as the row fields in the API (Statistics row).
| Symbol | Meaning |
|---|---|
base |
The base for shares of clicks: the larger of Prelanding: unique and Landing: unique. If the flow has no prelanding, it is just Landing: unique. |
cw, ch, ca, cc, cx |
The number of leads in the phases “Wait”, “Hold”, “Approve”, “Cancel” and “Trash” (Order phases). A lead is always in exactly one phase. |
ct |
Leads without trash: cw + ch + ca + cc. |
mw, mh, ma, mc |
Your commission for leads in the phases “Wait”, “Hold”, “Approve” and “Cancel”. |
c1…c12 |
The number of orders in the status with this code (Order statuses). |
Symbols in the formulas.
Keep these points in mind when you check the numbers:
- If a denominator is zero, the cell shows zero instead of a division result, and EPC shows a dash.
- Clicks fall into a period by click time, and leads by order creation time. A lead created today from yesterday's click is counted in today's leads, while the click stays in yesterday's clicks. That is why the CR of short periods can jump.
- Money is your commission. It is shown in the report currency: the network's main currency by default, or the one selected above the table if the network offers a choice of currency. A commission credited in another currency is converted at the current rate, not at the rate on the day of the lead.
- The platform does not store ready-made percentages. It counts clicks and leads, and it calculates shares and averages from them each time you open a report. The exception is the metrics next to a flow, offer and landing.
Clicks: prelanding and landing#
A flow can send a visitor to a prelanding first and then to a landing, or straight to a landing. In the second case the prelanding columns are zero. Both pages are counted the same way, separately from each other.
| In “Settings” | In the table header | What it counts |
|---|---|---|
| Prelanding: clicks | “Prelanding”, “Clicks” | All clicks to the prelanding. |
| Prelanding: unique | “Prelanding”, “Unique” | Unique clicks to the prelanding. |
| Prelanding: failure percent | “Prelanding”, the “%” icon (“Failure percent”) | (clicks − clicks without failure) / clicks × 100. |
| Prelanding: time on site | “Prelanding”, the clock icon (“Average time on the site, seconds”) | The average time on the page in seconds: the total time of all visits divided by the number of clicks. |
| Prelanding: transfers to landing | “Prelanding”, the “→” icon (“Prelanding to landing conversion ratio”) | The share of prelanding visitors who reached the landing: Landing: unique / Prelanding: unique × 100. |
| Landing: clicks | “Landing”, “Clicks” | All clicks to the landing, including those that came from the prelanding. |
| Landing: unique | “Landing”, “Unique” | Unique clicks to the landing. |
| Landing: failure percent | “Landing”, the “%” icon | (clicks − clicks without failure) / clicks × 100. |
| Landing: time on site | “Landing”, the clock icon | The average time on the page in seconds, as for the prelanding. |
Click columns. If the flow has no prelanding, the prelanding columns are zero.
Everything here rests on three concepts:
- Unique click — the first time in a day that a visitor goes to this page through this flow. The platform remembers the visitor in a cookie for a day. To see why the platform's unique clicks differ from the ad network's, read Where the numbers come from.
- Failure — a visit shorter than the failure time the network sets (10 seconds by default). A click without failure is a visit at least that long.
- Time on the page. The platform accumulates it in 5-second ticks. The table shows it already converted to seconds, so you do not need to recalculate it (the API returns the same value in five-second ticks).

Conversion and income per click#
| Column | Formula | What it shows |
|---|---|---|
| CR | ct / base × 100 |
How many leads without trash one unique click brought, in percent. |
| EPC | (ma + mh) / base |
The average income from one unique click. |
Conversion and income per click.
CR counts all leads without trash, waiting and canceled ones included. It shows how many leads the traffic brought, not how many of them were confirmed. EPC counts only the commission in the phases “Hold” and “Approve”. Waiting and canceled leads are not part of the income. For the confirmed share of leads, see approve.
Both metrics divide by clicks. Turn on the Show target (valid) clicks only button (Summary statistics) and the clicks of filtered-out traffic are not counted, while the leads stay the same. Then base gets smaller, and CR and EPC grow. That is a different counting method, not better traffic quality.
Approve#
Approve is the share of leads that reached confirmation. An affiliate's reports have two approve columns: without trash and with trash. Leads on hold count as confirmed, because the lead is already accepted and its commission only waits for the hold period to end.
| In “Settings” | In the table header | Formula |
|---|---|---|
| Approve (valid leads) | the “%” icon (“Approve rate (valid only, without trash)”) | (ca + ch) / ct × 100 |
| Approve (including trash) | the “%%” icon (“Approve rate (all leads including trash)”) | (ca + ch) / (ct + cx) × 100 |
Two approve columns. If there are neither approved leads nor leads on hold, approve is zero.
The denominator includes waiting leads. Until leads are processed, they pull approve down. So approve for the last few days is usually too low and changes as leads are processed.
These two columns are the approve of the reports in the “Statistics” section, including the hierarchical report “Click analytics”. In the “Lead analytics” report, if your network shows it, approve is split into separate columns with other formulas. For example, “Approve: valid” counts only accepted leads, without leads on hold, as a share of valid leads. Read such a column by its name, not by the formulas on this page. The approve next to a flow and an offer is a cached metric.
Leads and money#
Each lead is in exactly one phase. The columns show the number of leads and the commission for them, each separately or all counters at once in the Leads count: all-in-one column.
| Count | Amount | Phase | In the table header |
|---|---|---|---|
| Leads count: total | Leads money: total | “Wait”, “Hold”, “Approve” and “Cancel” together, without trash: ct, mt = mw + mh + ma + mc |
the “Total” group |
| Leads count: approved | Leads money: approved | “Approve”: ca, ma |
the “Accepted” group |
| Leads count: waiting | Leads money: waiting | “Wait”: cw, mw |
the “Waiting” group |
| Leads count: hold | Leads money: hold | “Hold”: ch, mh |
the “Hold” group |
| Leads count: canceled | Leads money: canceled | “Cancel”: cc, mc |
the “Cancelled” group |
| Leads count: trash | — | “Trash”: cx |
the “Trash” column in the “Cancelled” group |
Counters and amounts by phase.
The cabinet has no amount for trash: the commission for such leads has no column of its own. The Leads count: all-in-one column shows six counters as icons in this order: “Total”, “Waiting”, “Hold”, “Accepted”, “Cancelled”, “Trash”. It has no amounts. A nonzero number in a cell is a link to the list of those leads (Summary statistics).
The Leads money: income, expense and profit column splits the commission for accepted leads into three values in the “Money” group:
| In the table header | What it counts |
|---|---|
| “Income” | The sum of positive credits for leads in the “Approve” phase. |
| “Expense” | The sum of negative credits for leads in the “Approve” phase. The number is negative. |
| “Profit” | The sum of the first two, that is, ma. |
Income, expense and profit for accepted leads.
Amounts in the table are highlighted: positive in green, negative in red, zero in gray.
How values are shown and what is in the “Total” row#
The cabinet rounds values for display, and it cuts some of them off. In the API the values are raw, so your calculation by the formulas can differ slightly from the numbers in the table.
| Metric | How it is shown |
|---|---|
| CR, EPC | Two decimal places, rounded. |
| Approve, failure percent, transfer percent | A whole number: the fractional part is dropped, not rounded. An approve of 66.7% looks like 66. |
| Time on the page | Whole seconds. The fractional part is dropped. |
| Buyout, ROI | One decimal place. |
| Amounts | Up to two decimal places. |
How the cabinet shows values.
The “Total” row sits under the table when the table has more than one row. Counters and amounts in it are summed over the rows. CR, EPC, approve, failure, transfer, buyout and ROI are recalculated from those sums, not averaged. The exception is time on the page: in “Total” it is a plain average of the row values, so every row weighs the same, however many clicks it has.
Example: one report row#
The numbers are made up and not from your cabinet. They are here only to show how the formulas work together.
| What the row has | Value |
|---|---|
| Prelanding: unique | 200 |
| Landing: unique | 150 |
| Landing: clicks | 190, of them 135 without failure |
| Leads: waiting, hold, approved, canceled, trash | 4, 2, 6, 6, 2 |
| Commission: approved, hold | 60 and 20 |
Starting numbers.
| Column | Calculation | In the report |
|---|---|---|
base |
the larger of 200 and 150 | 200 |
ct |
4 + 2 + 6 + 6 | 18 |
| CR | 18 / 200 × 100 | 9.00 |
| EPC | (60 + 20) / 200 | 0.40 |
| Approve (valid leads) | (6 + 2) / 18 × 100 = 44.44 | 44 |
| Approve (including trash) | (6 + 2) / (18 + 2) × 100 | 40 |
| Landing: failure percent | (190 − 135) / 190 × 100 = 28.95 | 28 |
| Prelanding: transfers to landing | 150 / 200 × 100 | 75 |
What the columns will show.
Metrics next to a flow, offer and landing#
Next to a name in the flow list, in the Offers catalog and on the offer page you see their own Approve, CR and EPC. Landings and prelandings have them too, in the lists on the offer page and in the flow form. A flow in the list also has Total. The network can hide Approve, CR and EPC. They mean the same as in the reports but are calculated differently:
- They are not calculated when you open the page. The platform recalculates them in the background, on a schedule. Where the numbers come from explains why a number on a card can lag behind a fresh report.
- They cover the last few days, not the period selected in the report. The network sets the length of the statistics period: 15 days by default, from 7 to 90.
- Approve is
(ch + ca) / (cw + ch + ca + cc) × 100. Trash is not included. - CR is
leads without trash / unique clicks on landings × 100. The prelanding does not take part in the base. The exception is the row of the prelanding itself, where the base is the clicks on it. If the network counts all clicks instead of unique ones, the base is all clicks. - EPC is the commission for leads in the phases “Hold” and “Approve”, divided by the same clicks.
- For a flow, the metrics are calculated over the flow itself. For an offer and a landing, they are calculated over all the network's traffic to that offer or page, not over your flows.
- Total for a flow is how much commission the flow has brought over all time, not over the statistics period.
- An agency has no flows, so it has no metrics next to a flow.

Extra metrics#
Not every network has the columns of this group. The network turns them on itself: for detailed delivery statuses and cost price, for traffic expenses, for goal statistics blocks. If the network has not turned something on, those columns are neither in the table nor in the Settings window. The same metrics in the API are the fields bill, bills, cost, cpv, cpc and goal-<code>: Extra fields.
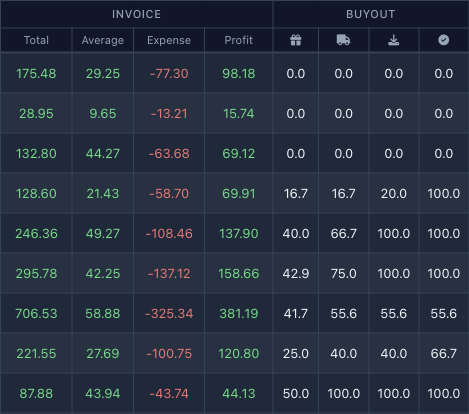
Invoice and buyout
Both groups are calculated from orders in delivery statuses 6 to 11: “Packing” (6), “Sending” (7), “Transfer” (8), “Arrived” (9), “Completed” (10) and “Return” (11) (Order statuses). An order falls into a period by its creation date and is counted in the status it has now, so the buyout of a recent period changes while parcels are still on the way. Orders in the “Return” status (11) also count toward the invoice and toward the buyout denominators.
An invoice is the amount of the customer's order, not your commission. Your money is in the “Leads money” columns.
| In “Settings” | In the table header | Formula |
|---|---|---|
| Invoice: total | the “Invoice” group, “Total” | The sum of customer invoices over orders in statuses 6–11. |
| Invoice: average | the “Invoice” group, “Average” | Invoice: total / the number of these orders. If there are no orders, zero. |
| Invoice: expense | the “Invoice” group, “Expense” | The cost price of the same orders (goods, services and delivery), with a minus sign. |
| Invoice: profit | the “Invoice” group, “Profit” | Invoice: total − cost price. |
Columns of the “Invoice” group.
Buyout is the share of orders in the “Completed” status (10) among the orders on an ever narrower stretch of the parcel's journey. The four columns differ only in the denominator:
| In “Settings” | In the table header | Formula |
|---|---|---|
| Buyout: approved | the gift icon (“The percentage of buyout among all approved orders”) | c10 / (c6 + c7 + c8 + c9 + c10 + c11) × 100 |
| Buyout: in transfer | the truck icon (“The percentage of buyout among parcels in transit”) | c10 / (c8 + c9 + c10 + c11) × 100 |
| Buyout: delivered | the down-arrow icon (“The percentage of buyout among delivered parcels”) | c10 / (c9 + c10 + c11) × 100 |
| Buyout: completed | the checkmark-in-a-circle icon (“The percentage of buyout among completed parcels”) | c10 / (c10 + c11) × 100 |
Columns of the “Buyout” group. If there are no orders in the “Completed” status, buyout is zero.
An example with made-up numbers: a row has 2 orders in “Packing”, 1 in “Sending”, 3 in “Transfer”, 2 in “Arrived”, 5 in “Completed” and 2 in “Return”. Then the buyout by column is: Buyout: approved 33.3 (5 of 15), Buyout: in transfer 41.7 (5 of 12), Buyout: delivered 55.6 (5 of 9), Buyout: completed 71.4 (5 of 7).
Traffic and ROI
The “Traffic” group shows the return on paid traffic. It is calculated over clicks that have a price. The price comes in through a macro in the flow URL, a connected ad network, a manual upload or the API (Expenses). The price is stored in the click's currency and converted to the report currency at the current rate.
| In “Settings” | Formula |
|---|---|
| CPC: clicks | The number of clicks that have a price. |
| CPC: cost per click | CPC: total expense / CPC: clicks. Up to four decimal places (up to six in the “Total” row), trailing zeros are not shown. |
| CPC: total expense | The sum of the prices of these clicks. |
| CPC: profit | (ma + mh) − CPC: total expense. |
| CPC: ROI | (ma + mh) / CPC: total expense × 100. |
Columns of the “Traffic” group. In the table header they are called “Clicks”, CPC, “Expense”, “Profit” and ROI.
- ROI 100 means you broke even. ROI 150 means that for every unit you spent, one and a half came back.
- If there is no expense or no income (no leads in the phases “Approve” and “Hold”), ROI shows zero, not a division by zero and not a negative number. The loss is visible in the CPC: profit column.
- The income in profit and ROI is taken over all leads of the row, while the expense is taken only over clicks with a price. If not all clicks of a flow have a price, profit and ROI come out too high.
The columns of this group are filled only when a price is passed to the click. The agency cabinet has neither the “Import spend and CPC” item nor flows where the price is set, so these columns are zero by default.
Goal metrics
The network can set up statistics blocks for goals. This is useful, for example, for revshare offers. Then the table gets a separate column group for each goal, named after the goal. The network sets the names. In the Settings window the columns are called “Goal: metric”, for example Registration: CR or Deposit: EPC.
A lead goes into the block of the goal it belongs to. A lead whose goal is in no block goes into the default block, if the network has set one.
In the formulas below, cw, ch, ca, cc, cx, ma and mh are the goal's leads and the commission for them, and base is the same as in the main row:
| Column after the goal name | Formula |
|---|---|
| CR | (cw + ch + ca + cc) / base × 100. |
| EPC | (ma + mh) / base. |
| approve | (ca + ch) / valid leads × 100. |
| total approve | (ca + ch) / lead count × 100. |
| lead count | cw + ch + ca + cc + cx: all leads of the goal, including trash. |
| valid leads | cw + ch + ca + cc: without trash. |
| waiting leads, leads on hold, accepted leads, canceled leads, trash leads | The number of the goal's leads in the phases “Wait”, “Hold”, “Approve”, “Cancel” and “Trash”. |
| hold amount | mh. |
| earned amount | ma. |
| total amount | ma + mh. |
Goal block columns. The network turns on each of them separately.