On this page
A regular report groups clicks and leads by one dimension: by date, by offer, by country. A hierarchical report groups them by a chain of dimensions. First you see the first level, for example traffic sources. Expand a row and you see the same row broken down by the next dimension: the campaigns of that source. Expand a campaign and you see its creatives, and so on to the end of the chain. This way you find the combination that brings leads, and you don't build a separate report for every pair of values.
There are four such reports: Clicks by UTM, Clicks by sites, Clicks by device and Click analytics. Agencies get a fifth one, External marks. Flat reports are described on the Summary statistics page.
Where to open a report#
Open the Statistics menu and select the report you need. The network can hide any of these reports, and then the menu has no such item. The External marks item is only in the agency menu.
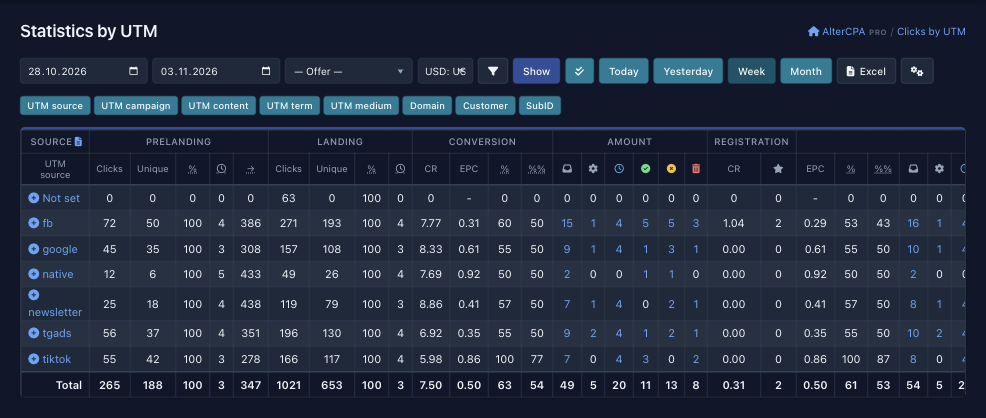
All these reports have the same layout. At the top is the report toolbar: the start and end dates, an offer selector, a funnel button for additional filters, the Show button, the period buttons Today, Yesterday, Week and Month, the Excel button, and a gear button for column settings. Under the toolbar is a row of tags. These are the report's dimensions in the order in which they expand. The table comes next. By default the report shows the last seven days.
 123
The first column of the table is titled “Source”. Under it is the name of the dimension of the current level, for example “UTM source”. The other columns show clicks, leads and money for each value. Which columns you see depends on the network and your settings, see Table columns.
How to expand a row#
-
Click the row name. A row that you can expand has a plus icon in a circle before its name. The page does not reload.
-
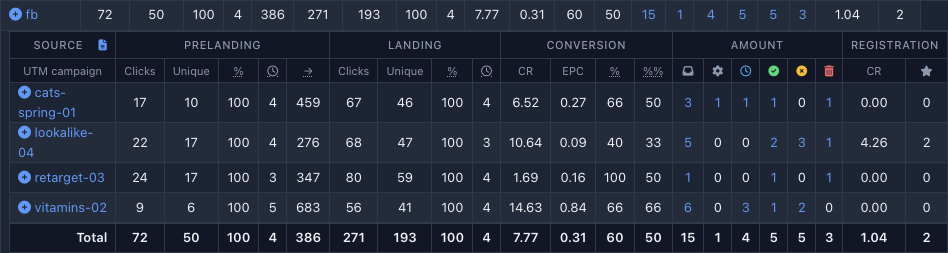
Read the nested table. It appears right under the row, inside the main table, with its own header. The first column of the header holds the name of the next dimension in the chain. The table has only the clicks and leads that belong to the value of your row. The platform adds that value as a filter to the selected period and to all the values you expanded above.
-
Keep expanding. The rows of the new table have a plus icon too. The upper levels stay in place, so you can expand several rows at once and compare them with each other.
-
Collapse a row. Click the same row again to remove the nested table. The next time you expand it, the platform loads it again.
 12
The table can have a row with the value Not set. It collects the clicks and leads that have no such tag. You can expand it like any other row.
You can expand rows as long as the chain has dimensions with no filter yet. On the last level the row name turns into plain text, and there is no plus icon. If you filtered all the dimensions after the current one yourself, the icon stays, but the expanded row shows an empty table with the message “No statistics found for chosen period”.
To get to the leads, click a number in the row, not its name. The lead count, total and by phase (Waiting, Hold, Accepted, Cancelled, Trash), becomes a link when there are leads. Phases are described in the Order phases section. The link opens the Leads and orders list for the same period, filtered by all the values you went through: source, campaign and so on. This works on every level, not only the last one. If there are no leads, the cell holds a plain zero with no link.
The rows of every table are in alphabetical order. In the “Click analytics” report, dates go from newest to oldest and hours in ascending order. To sort the rows of a table, click a column name in its header. At the bottom of the table is the Total row if the table has more than one row.
Order of dimensions#
Every report has its own default chain of dimensions, shown in the Reports and their chains table. You can change its order, because the row of tags under the report toolbar consists of draggable tags. For example, in the “Clicks by UTM” report put UTM campaign first, and the first level shows the campaigns of all sources at once.
-
Drag the tags with the mouse. The first tag becomes level one, the second becomes level two, and so on.
-
Apply the order. Click Show on the report toolbar. The order is applied together with the dates and the offer.
On a narrow screen the row of tags is collapsed under the Marks order button, and the report toolbar under the Filter button. Click Marks order to open the row of tags. A Show button of its own appears under it. Drag the tags and click that button. If you hover over Marks order, the browser shows the tooltip “You can change the order of marks by moving them with mouse”.
 12
The report always opens grouped by the first dimension, in the order of the tags, that has no filter yet. If you selected an offer on the toolbar or filled in a field in the search window (see Report toolbar), the report skips those dimensions, and the first level is the next one. A tag with a filter set is colored differently from a free tag.
The platform remembers the order you chose separately for each report, in your browser session. If you open a report from the menu, without parameters, it shows the order you applied last, not the default one. Logging out of the cabinet does not reset the order, but in another browser or on another device the report opens in the default order. There is no “reset” button. To go back, arrange the tags as in the Reports and their chains table and click Show.
Reports and their chains#
A report's depth is the length of its dimension chain. Levels have no separate limit.
| Report | Default chain | Levels |
|---|---|---|
| Clicks by UTM | UTM source → UTM campaign → UTM content → UTM term → UTM medium → Domain → Customer → SubID | 8 |
| Clicks by sites | Landing → Prelanding → Domain | 3 |
| Clicks by device | Device → Browser → OS → Domain | 4 |
| Click analytics | Offer → Country → Flow → Date → Hour → Landing → Prelanding → UTM source → UTM campaign → UTM content → UTM term → UTM medium → Domain → Customer → SubID → Device → Browser → OS → Source → Filter | 20 |
| External marks (agency only) | Agency source → Agency lead → Domain → UTM source → UTM campaign → UTM content → UTM term → UTM medium | 8 |
Hierarchical reports and their chains.
Clicks by sites is the shortest report, and Click analytics is the deepest: it includes almost all dimensions at once.
The chain depends on the network. The network can remove individual dimensions from the reports. Landing and Prelanding are there only if the network shows the click columns by landings and by prelandings, and Source is there only if the network shows traffic sources. If a dimension from the table below is missing among the tags, the network has hidden it.
For an agency, the Click analytics report is different. Its chain has no Flow dimension, because an agency has no flows, and Agency source and Agency lead come right after Country. That makes 21 levels in all. What these tags are is explained in the Tags for agencies section.
A team has its own versions of Clicks by UTM, Clicks by sites, Clicks by device and Click analytics in the Team menu. They count the clicks and leads of all team members. In the team's “Click analytics”, the first dimension is User. See the Teamwork page for details.
Next to them in the menu is the Lead analytics item (if the network shows it). It is a different report. Its rows do not expand, and you set the grouping and the columns in the “Set up grouping” and “Set up columns” windows.
Dimensions#
The dimension names in the table match the names of the tags in the row above the report.
| Dimension | What it groups | Where it is |
|---|---|---|
| Offer | The offer the click was for | Click analytics |
| Country | The visitor's country | Click analytics |
| Flow | Your flow, see Creation and settings | Click analytics (not for agencies) |
| Date | The day of the click | Click analytics |
| Hour | The hour of the click, in intervals like 00:00-00:59. Only the hours with data are shown |
Click analytics |
| Landing, Prelanding | The site the click landed on and the site before it, see Landing and prelanding | Clicks by sites, Click analytics |
| UTM source, UTM campaign, UTM content, UTM term, UTM medium | Link tags, see Main tags | Clicks by UTM, External marks, Click analytics |
| Domain | The domain the visitor came to | All hierarchical reports |
| Customer, SubID | Link tags, same place | Clicks by UTM, Click analytics |
| Device | Desktop or Mobile | Clicks by device, Click analytics |
| Browser, OS | The visitor's browser and operating system | Clicks by device, Click analytics |
| Source | The flow's traffic source, see Traffic source | Click analytics |
| Filter | The result of filtering the click: Valid visit, or the reason the click was cut off (Ban: filters, Ban: bot, Ban: blacklist, Ban: country, Ban: language, Ban: ad click ID, Ban: trafback). The “Ban: device” item is in the list of conditions, but the platform does not record that reason | Click analytics |
| Agency source, Agency lead | Agency only: your exts and extu identifiers, see Tags for agencies |
External marks, Click analytics |
| User | Team only: a team member | Team's Click analytics |
Dimensions of hierarchical reports.
Report toolbar#
- Two date fields and the buttons Today, Yesterday, Week, Month. The period buttons refresh the report at once.
- The offer drop-down list. The selected offer becomes a filter for the whole report.
- The funnel button opens the Search window with additional filters: Flow, Country, Landing, Prelanding, the five UTM tags, Domain, Customer, Device, OS, Browser, Traffic source and Filtering result. Which of them you see depends on the report and the network. For an agency, “Source order ID” and “Source affiliate ID” replace Flow, Landing and Prelanding. Next to a tag field is the empty value checkbox. It looks for clicks that have no such tag. The Find button applies the filters, and the number on the funnel button shows how many filters from this window are set.
- Show applies the dates, the offer and the order of tags.
- The button with a double check mark turns on the Show target (valid) clicks only mode.
- Excel exports the table to a file. The file holds one level: the one whose header you export from. The export icon is also in the header of a nested table.
- The gear button opens the Settings window with the list of columns. Select the ones you need and click Save.
Table columns#
The columns are the same as in the flat reports (Summary statistics). The formulas and the meaning of each column are on the Metrics and formulas page, so they are not repeated here. A nested table shows the same columns as the top level.
Almost every network has the main columns: clicks and unique clicks by landing and prelanding, CR, EPC, approve, the number of leads, and money by phase. Not every network turns on the additional columns: invoice and buyout, expenses and ROI by click price, and the goal columns the network created itself, for example “Registration” or “Deposit”. What you see depends on the network and the Settings window. Your choice of columns is saved in your profile and applies to all reports with statistics columns, flat and hierarchical.
When to choose a hierarchical report#
Flat and hierarchical reports count the same metrics for clicks and leads. The difference is how many dimensions the data is grouped by and what a click on a row does. In a flat report the data is grouped by one dimension, the row name is plain text, and the numbers in the row lead to the leads. In a hierarchical report the name expands the next level, and the lead numbers still lead to the list of leads. Where the numbers come from, and why a hierarchical report is always calculated live, is explained on the Where the numbers come from page.
Use a flat report when the question is about one dimension: how clicks were distributed by date, or which offer brings more leads. Use a hierarchical report when the question is about a combination of dimensions and you don't know in advance which combination will turn out interesting. Look at the whole top level, then expand only the rows that are worth it.