On this page
Two figures for the same period can differ. The platform calculates some numbers ahead of time and refreshes them on a schedule. It calculates others at the moment you open the page. Clicks and leads are stored differently, and a day can start at a different time for different readers. This page explains where each number comes from and lists the reasons figures differ. For what each column means and the formula behind it, see Metrics and formulas.
Where the numbers come from#
In any report row, click metrics and lead metrics sit side by side, and each has its own source.
| What is in the row | Where it comes from | When it updates |
|---|---|---|
| Clicks, unique clicks, bounces, time on site for the prelanding and the landing | Click records. For past days a report sometimes uses ready-made daily totals | A click appears in the report right after the visit |
| Leads: count by phase and amounts | The orders themselves | Every time you open a report, always current |
| Cost per click and expense | The price written into the click (Expenses) | When the price is written or rewritten. You can no longer change it for archived clicks |
| Approve, CR and EPC in the lists of flows, landings and offers | Ready-made values that the platform recalculates on a schedule | From half an hour to several hours |
| “Total” in the flow list | Commissions accrued for the flow | At once, as soon as a commission is accrued for an order |
Sources of the numbers.
A click and a lead each get into a report by their own data. A click gets its row by the click time and its own tags. A lead gets its row by the time the order was created and by the tags saved in the order itself. So a click and the order placed from it can land in different rows. They land on adjacent days if the order is created after midnight, or in different hours. An order without tags lands in the “Not set” row, while the click stays in the row of its campaign. The daily CR is the day's leads divided by the day's clicks. It does not follow the same visitors.
The Lead analytics report works differently. It counts orders, so neither daily totals nor the click lifetime affect it. Everything said below about clicks applies to the other reports in the Statistics section, including Click analytics.
Fresh clicks and the archive#
Clicks are stored in two stages.
- Fresh clicks. Clicks from the last 30 days by default. While a click is fresh, you can correct its price (Expenses).
- Archive. Every night the platform moves clicks older than that period to the archive. You can no longer change the price of an archived click.
- Deletion. The platform deletes clicks older than the lifetime from the archive, 360 days by default. Cleanup runs at night on the network's schedule, once a week by default, so a click can outlive the lifetime by several days.
The network sets both periods. Reports do not show the boundary. If a period covers both fresh and archived clicks, the platform adds them up itself. You notice the boundary in two cases. You cannot change the price of archived clicks, and clicks older than the lifetime disappear, see Old periods.
Leads are stored forever. The platform does not move them to the archive or delete them by age, so leads are counted for any period.
Daily totals#
Besides the clicks themselves, the platform stores daily totals: for each flow and each day, the number of clicks, unique clicks and non-bounce visits, separately for the prelanding and the landing. Every night, after midnight in network time, it closes the past day. A day's total is written once and never recalculated. Totals have no lifetime, so they stay after the clicks themselves are deleted.
Totals are faster than clicks but know only the day, the offer and the flow. So a report does not always use them.
| Report | Clicks of past days | Clicks of today |
|---|---|---|
| Clicks by date, Clicks by offer, Clicks by flow and Clicks statistics with the dimension “Date”, “Offer” or “Flow”, if there are no conditions other than offer and flow | From daily totals | From clicks |
| The other flat reports and the other dimensions on the Clicks statistics page | From clicks | From clicks |
| Hierarchical reports | From clicks | From clicks |
Where a report gets clicks from.
A report switches from totals to clicks if any of these conditions is met.
- The “Search” window has a condition turned on for country, landing, prelanding, UTM tags, domain, device, OS, browser, traffic source or filtering result.
- The Show target (valid) clicks only button is on (Target clicks only).
- Your profile has a personal timezone that differs from the network's.
- The report is hierarchical. It never uses totals, even when it groups by date or flow.
Totals include every click on the flows, including those that traffic filters screened out (Filtered traffic). Leads do not depend on totals. They are always counted from orders.
Two consequences for reading reports.
- Yesterday right after midnight. Until the night job has run, yesterday's clicks do not show yet in the reports from the first row of the table above, but the leads are already there.
- Today always comes from clicks. No report takes today from totals, so today updates at once.
Agency clicks have no flow, so they do not get into daily totals, and agency reports are always counted from the clicks themselves. You do not need to wait for the night job, because yesterday's clicks show right away. But once the click lifetime passes, there is no fallback source. Old clicks disappear from the reports by date and offer too (Old periods).
Percentages in lists of flows, landings and offers#
Approve, CR and EPC appear in three places: in the flow list, next to landings and prelandings (on the offer page and in the flow settings), and in the Offers catalog (if the network shows these columns). The platform does not calculate them when you open the page. It recalculates them in the background, and each place has its own interval.
| Where | How often | From what data |
|---|---|---|
| Flows by offers | All flows at once, every 30–90 minutes | The flow's leads and clicks |
| Landings and prelandings | Every three to four hours | All affiliates of the network |
| Offers catalog | Each offer every two to five hours | All affiliates of the network |
Recalculation of cached percentages.
The platform checks every ten minutes whether it is time to recalculate, so up to ten minutes are added to the interval. A fresh lead gets into a report at once, but it shows up in these columns only after the next recalculation. The agency has no flows, so the first row of the table does not concern it.
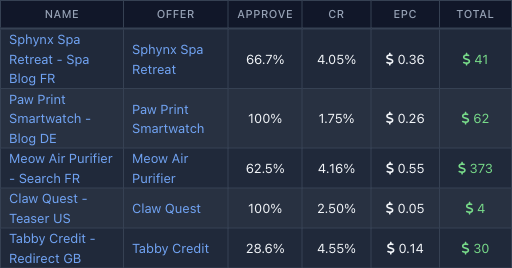
These values differ from the reports in three ways.
- Window. The calendar period is not what is counted. It is the last N days before the moment of recalculation. N is the statistics period that the network sets: 15 days by default, from 7 to 90. The window takes the leads without trash created in that time, and the clicks in that time.
- Clicks. The flow list takes the unique clicks on the flow's landing. For landings and prelandings it takes the clicks on that page. In a report, the denominator is the larger of the unique clicks of the prelanding and of the landing. So for a flow with a prelanding, CR and EPC in the list are usually higher than in the report for the same days. See Metrics and formulas for the formulas.
- Zeros. If a flow had no lead outside trash in the window, its approve, CR and EPC are set to zero. The recalculation covers only flows with leads, and old values are reset when they fall out of the window. The same holds for landings and prelandings. For offers, the values are calculated anew on every run.
The “Total” column works differently. It grows at once when a commission is accrued for an order, without waiting for the recalculation. So in the flow list, “Total” can already have grown while CR and approve next to it have not.
To see a flow's figures for specific days, open Clicks by flow (Summary statistics). It does not depend on this schedule.
Why the numbers do not match#
Find your case in the table and follow the link to the explanation.
| What you compare | Common cause | Explanation |
|---|---|---|
| The flow list and the report for the same flow | A different window, a different denominator, a scheduled recalculation | Percentages in lists |
| Two cabinet reports for one period | One used totals, the other clicks. The target clicks button is on in one of them | Daily totals, Filtered traffic |
| Yesterday early in the morning | The night job has not closed the day yet | Daily totals |
| The cabinet and the API | A cabinet day can follow your timezone, while the API always follows the network's | Timezone |
| Your report and a colleague's or support's report | Different timezones | Timezone |
| The same period today and a week ago | Lead statuses, exchange rate, cache recalculation | What changes after you open a report |
| The cabinet and an ad network or a tracker | Different ways to count unique clicks, filtering, days and postbacks | Ad network and tracker |
| Number of leads and approve percentage | Different denominators, trash | Trash and denominators |
| An old period | Clicks are deleted, totals and leads remain | Old periods |
| Totals for the past decreased | A flow or an offer was deleted | Deleted flows and offers |
Where to look for the cause of a discrepancy.
Timezone
The platform records a click and the creation of an order in network time. Reports show days and hours in the same time. If the network allows personal timezones and you chose yours in your profile (Profile, the Timezone field, see Profile), the cabinet's reports are built in your time. Both clicks and leads shift into your day.
Two people with different timezones who open a report for the same date see different figures, and both are right: their days start at different times. This is most visible in Clicks by hour, where a click near an hour boundary lands in a different row.
If your timezone differs from the network's, the platform does not use daily totals and counts from clicks. That is noticeably heavier for it, so such reports can open more slowly.
The API ignores a personal timezone. Days there always follow network time (Period and dates). If you compare the cabinet with an API response and have a different timezone set, the day boundaries do not match. To compare them, select the network's timezone in your profile. Or keep in mind that at the edges of the period some clicks fall into the adjacent days.
What changes after you open a report
Some numbers update on their own time, not when you look at them.
- Lead statuses. A report shows leads as they were when you opened it. A lead that was waiting for a decision yesterday can be approved or declined today. A lead on hold becomes approved when the hold ends. The network can decline leads that stay unprocessed for too long, automatically, on a timer, with a reason it sets. If that reason is in the set of trash reasons, the lead lands in “Trash” (Decline reasons).
- Cached percentages. The flow list, landings and offers lag behind the reports by the recalculation time (Percentages in lists).
- Day close. Yesterday's clicks appear in the reports by date, offer and flow after the night job (Daily totals).
- Exchange rate. If the network has more than one currency, lead amounts and expenses are converted to the report currency at the current rate when you open the report. The network updates the rates automatically. So an amount for a past period in a currency other than the orders' currency can differ slightly tomorrow from today's, although the orders are the same. Amounts in the orders' currency do not depend on the rate.
What counts as a unique click
The platform determines uniqueness by cookie. When someone opens a page (a landing or a prelanding), the platform sets a cookie with the flow number in the browser for one day. If the same browser opens the same page on the same flow again while the cookie is alive, the repeat click is not unique. Each visit extends the cookie by another day. The cookie holds only the last flow. If a visitor came through flow A, then through flow B, and then through A again, the third click is unique.
A click counts as unique again after the cookies are cleared. It also counts as unique in a browser that does not accept cookies. Ad networks and trackers usually determine uniqueness by IP address and device fingerprint, so their “uniques” do not match yours, and a moderate difference is normal. The “Unique” column, CR and EPC depend on the unique clicks (Metrics and formulas).
The agency has no flow, so the platform records each of its clicks as unique. The number of unique clicks in its reports equals the number of clicks.
Filtered traffic
The platform does not discard the clicks that traffic filters screened out. It records them with the reason for the screening (Filters and trafback). By default, reports count every click, filtered ones included. Daily totals do too.
To see only clean traffic, turn on the Show target (valid) clicks only button (Target clicks only) or select the Filtering result you need in the “Search” window. With the button on, there are never more clicks than without it, and often noticeably fewer. These are two questions: “how many clicks were there in total” and “how many of them passed the filters”. The button does not change leads, so with it CR and EPC are higher (if the filters screened anything out), but the traffic is no better for that. To compare two reports, set the button the same way in both.
Trash and denominators
A lead with a decline reason from the network's set is trash (Decline reasons). The “Total” counter does not include trash. Approve has two variants. “Approve (valid leads)” leaves trash out of the denominator, and “Approve (including trash)” keeps it. So dividing the number of approved leads by the number of orders in the Leads list (which includes trash too) does not give the report's figure. Both formulas are correct, they answer different questions. The formulas are in Metrics and formulas, and how the “Total” counter relates to the lead list is in the section From a number to leads.
Old periods
If you open a period whose clicks are already deleted (older than the lifetime from the section on storage), what you see depends on the report.
- The reports by date, offer and flow with no conditions other than offer and flow still show clicks. They take daily totals, which have no lifetime (unless you set a different timezone, see Timezone). This does not hold for the agency, see Daily totals.
- The other reports (by hour, country, source, site, device, UTM and Click analytics) do not find clicks for such a period. Rows with leads stay, but the click columns are zero, so there is nothing to calculate CR and EPC from. If the period had no leads, the report says “No statistics found for chosen period”.
- Browse clicks is empty for such a period.
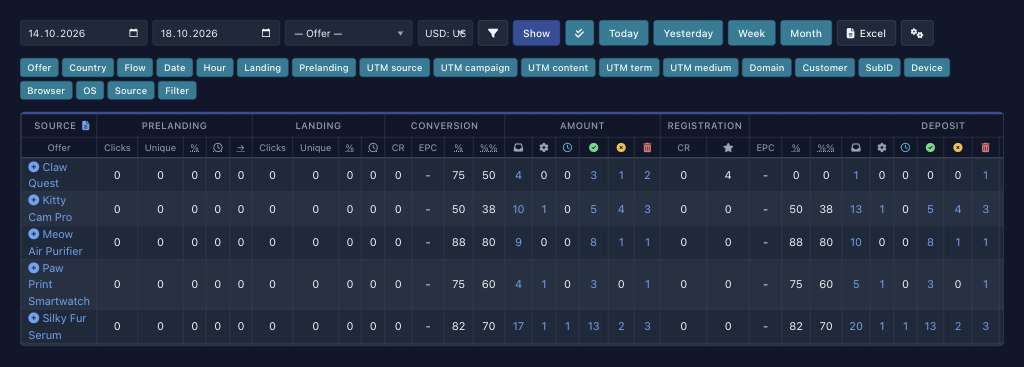
Leads in any report are counted from orders, and the click lifetime does not affect them.
Deleted flows and offers
- You deleted a flow. The flow's clicks, totals and orders stay in the database but lose their link to it. In the report by flow they gather into one row with no flow name, and in the reports by date and offer they stay as they were. A filter on the deleted flow finds nothing, and you cannot link the data back.
- The network deleted an offer. Its leads, flows and daily totals are deleted with it. Totals for past periods decrease after that. If they decreased for no visible reason, ask the network's support whether the offer was deleted.
Ad network and tracker
When you compare the cabinet with an ad network or a tracker, check these in turn.
- Unique clicks. The platform has its own method (What counts as a unique click), and they have theirs.
- Filtering. By default the cabinet also counts the clicks that filters screened out (Filtered traffic).
- Days. The day boundaries of the platform, of your profile and of the tracker can differ (Timezone).
- Statuses. A tracker learns about leads only from a postback. If you did not select the checkbox for a phase, or the postback URL does not change between events, the tracker does not receive some of the statuses (Protection against repeats, If a postback did not arrive).
For details on connecting a tracker, see Third-party trackers.
How to compare two reports#
-
Compare the periods and the timezone. Make sure both reports cover the same dates. If you compare the cabinet with the API, a colleague or a tracker, check the timezones (Timezone).
-
Compare the conditions. Make the offer, flow, “Search” window, target clicks button and currency match.
-
Find out where the numbers come from. Check the table in Daily totals to see whether the clicks of past days come from totals or from clicks. Leads always come from orders.
-
Rule out the lag. If one of the screens is a list of flows, landings or offers, compare against a report, not against the list (Percentages in lists). If the period includes yesterday, wait until the day closes.
-
Compare the denominators. For CR, EPC and approve, look at which clicks and leads went into the calculation (Metrics and formulas).
If the numbers still do not match after these checks, write to support and attach both screens with the periods and conditions. This way they find the cause faster.